I'm Invested in Data Science
Background
Marc Andreessen’s acclaimed article, Why Software Is Eating the World, was published 7 years ago. It was a proclamation of victory; after six decades of computing advancements, software was ready to pervade every facet of life. And it has.
There was no finish line in sight for this computing revolution in 2011. Pervasive software required eyes and ears for feedback; this led to a new wave of information collection and integrated sensors. Data got “big” and scalable infrastructures were introduced to efficiently store and query. Thus, the new age of data science found its footing. Today’s prime challenges involve effectively putting the data to work for the purpose of extracting an ROI.
An Elementary Application of Data: Data Visualization
I drove from Illinois to California early this summer. I planned out a tentative route and had an idea of how long the trip would take. But I desired an accurate record of my route which I could keep and share with others. I downloaded GPS Tracks on my iPhone, and decided to use the app to record my PVT (position-velocity-time) data throughout my cross-country drive. It was an effortless process that would pay dividends during the trip.
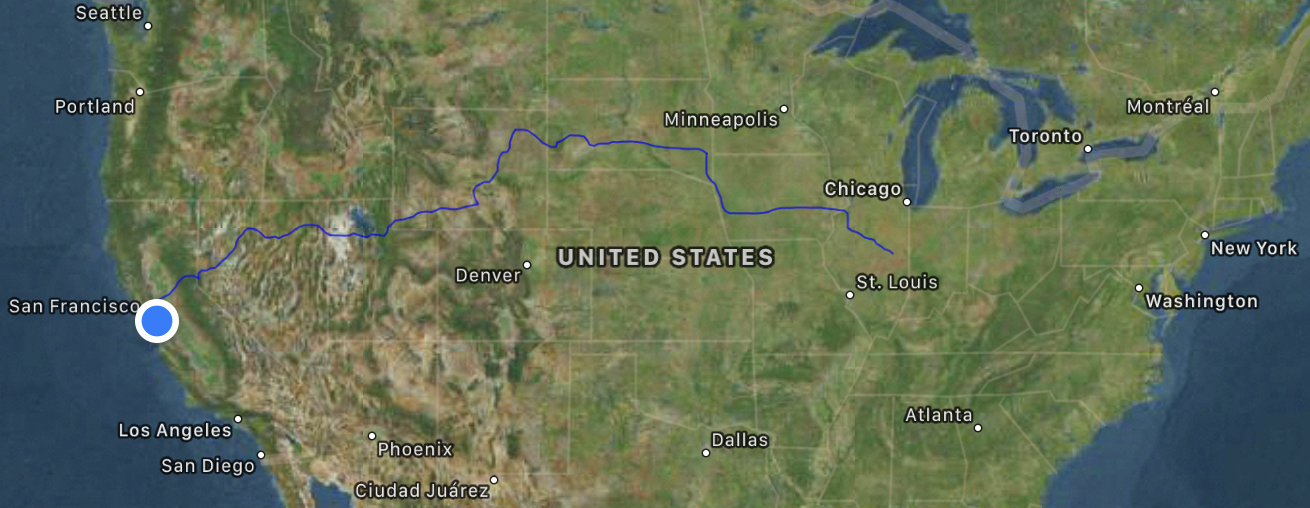
I was excited to review the summary data readily provided by GPS Tracks (e.g. time logged, distance covered, average speed, change in altitude) at the end of each day’s drive. The parameters would help me plan the next day’s route. After reaching my destination in California, I exported 30.4 MB of raw PVT data from the app to my computer.
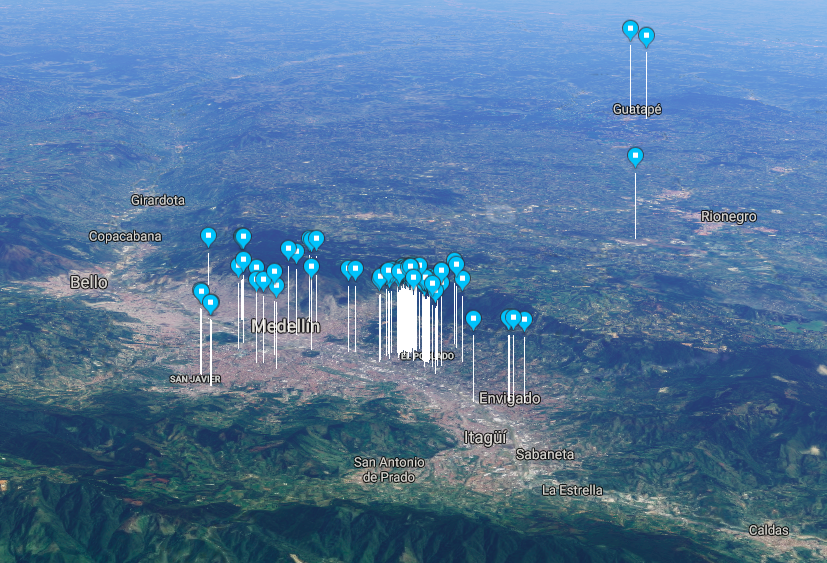
Approximately two weeks later, I would land in Medellin, Colombia for a 5-week stay with an old college roommate. Once again, I desired some kind of record of my activity. I started saving the location of every establishment I visited via Google Maps. It was insightful to visually see the range and intensity of my exploration.
Diagnosing Productivity with Data
After returning from Medellin, I struggled to embrace a productive routine. I was lacking focus and discipline. I began to address the problem by quantifying it. I started logging how much time I was spending on various activities using an application named Toggl. With both the desktop and mobile apps installed, I found it easy to stay on top of my log. Switching the log from one activity to another only required a couple of swipes or clicks. However, it was inevitable that I would have to backlog some amount of time every day.
I tracked and reviewed of a handful of parameters on a weekly basis. I found personal tendencies and leveraged them to re-shape my daily routine. An unintended side-effect was the gamification of my schedule: I found myself striving to either maintain or beat a handful of productivity parameters that I logged in the prior week.
I expect to cease my daily logging after I achieve a steady routine that I am satisfied with. But this leveraging of data to build and maintain habits is proving to be successful.
Takeaways
The individual elements of data science have been around for a long, long time. But the environment we live in has evolved drastically. Many of us have the immense computing power of a smartphone within arm’s reach wherever we go. Furthermore, the development of data infrastructure, tools, and accessibility provide us with a capability that did not exist just a few years ago. I have been tinkering with data science at a small scale and rudimentary level. But I look forward to scaling up, and implementing data science with rigor.